1. 故障排查整体思路
故障排查三步走:
1、分类。故障排查的第一步是分类,缩小问题范围。
2、套路。不同问题,有不同的标准排查方法,详情可以参考阿里云ACK - 故障排除。
3、发散。百度+谷歌+ChatGPT,搜寻各种可能的解决办法并进行尝试。
本文中,我们主要学习故障排查的套路(标准流程)。
参考文档:
- 阿里云ACK - 故障排除
- 阿里云ACK - 节点异常问题排查
- 腾讯云TKE - 故障处理
- 腾讯云TKE - Pod 异常排查概述
- 应用故障排查
- Kubernetes 网络异常分类及排错指南
- k8s实践指南-排错案例-分析 ExitCode 定位 Pod 异常退出原因
2. 问题分类
K8S中的问题可以分为下面几类:
- 节点异常
- Pod异常
- DNS解析异常
- Service异常
- Ingress异常
- 存储异常
- 组件异常
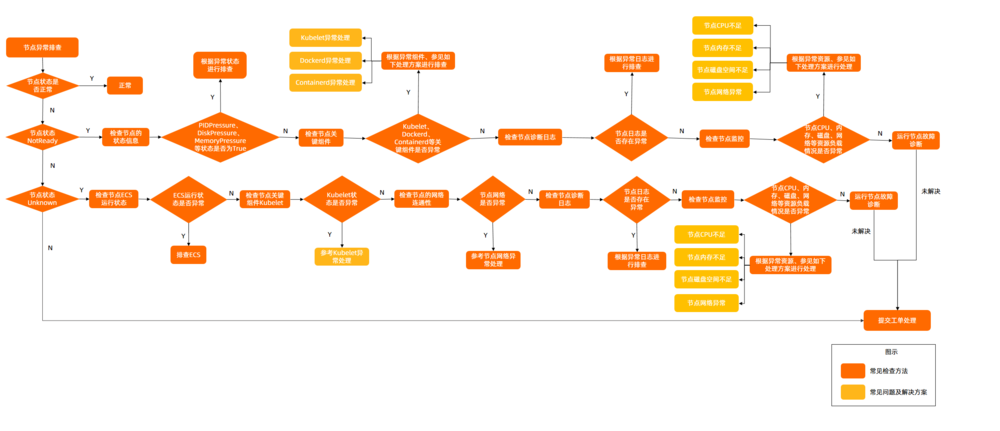
3. 节点异常问题排查
3.1. 排查思路
3.2. 查看节点状态
1 | kubectl describe nodes $nodename |
3.3. 查看ntp
1 | systemctl status chronyd |
3.4. 重启kubelet和docker
1 | systemctl stop kubelet |
3.5. PLEG问题
Pod生命周期事件生成器PLEG(Pod Lifecycle Event Generator)会记录Pod生命周期中的各种事件,如容器的启动、终止等。
PLEG is not healthy 异常通常是由于节点上的运行时进程异常或者节点Systemd版本缺陷导致。
4. Pod异常问题排查
未完待续。。。
5. DNS解析异常问题排查
未完待续。。。
6. Service异常问题排查
未完待续。。。
7. Ingress异常问题排查
未完待续。。。
8. 存储异常问题排查
未完待续。。。
9. 组件异常问题排查
未完待续。。。