-n requests Number of requests toperform -c concurrency Number of multiple requests to make at a time -t timelimit Seconds to max. to spend on benchmarking This implies -n 50000 -s timeout Seconds to max. wait foreach response Defaultis30 seconds -b windowsize Size of TCP send/receive buffer, in bytes -B address Address to bind towhen making outgoing connections -p postfile File containing data to POST. Remember alsotoset -T -u putfile File containing data to PUT. Remember alsotoset -T -T content-type Content-typeheaderto use for POST/PUT data, eg. 'application/x-www-form-urlencoded' Defaultis'text/plain' -v verbosity How much troubleshooting infoto print -w Print out results in HTML tables -i Use HEAD insteadofGET -x attributes String toinsertastable attributes -y attributes String toinsertas tr attributes -z attributes String toinsertas td or th attributes -C attributeAdd cookie, eg. 'Apache=1234'. (repeatable) -H attributeAdd Arbitrary headerline, eg. 'Accept-Encoding: gzip' Inserted afterall normal header lines. (repeatable) -A attributeAdd Basic WWW Authentication, the attributes are a colon separated username andpassword. -P attributeAdd Basic Proxy Authentication, the attributes are a colon separated username andpassword. -X proxy:port Proxyserver and port number to use -V Print version number andexit -k Use HTTP KeepAlive feature -d Donotshow percentiles served table. -S Donotshow confidence estimators and warnings. -q Donotshow progress when doing more than 150 requests -l Accept variable document length (use this for dynamic pages) -g filename Output collected data to gnuplot format file. -e filename Output CSV file with percentages served -r Don't exit on socket receive errors. -m method Method name -h Display usage information (this message) -Z ciphersuite Specify SSL/TLS cipher suite (See openssl ciphers) -f protocol Specify SSL/TLS protocol (TLS1, TLS1.1, TLS1.2 or ALL)
1、模拟10个client,总共发送100个请求(每个client发送10个请求) ab -n 100 -c 10 http://localhost/ 注意网址后面要加”/“或者明确的path。 运行结果如下:
This is ApacheBench, Version 2.3<$Revision:1706008 $> Copyright 1996 Adam Twiss, Zeus Technology Ltd, http://www.zeustech.net/ Licensed to The Apache Software Foundation, http://www.apache.org/
Benchmarking localhost (be patient).....done
Server Software: Apache/2.4.18 Server Hostname: localhost Server Port:80
Document Path:/ Document Length:11321 bytes
Concurrency Level:10 Time taken for tests:0.013 seconds Complete requests:100 Failed requests:0 Total transferred:1159500 bytes HTML transferred:1132100 bytes # 相当于LoadRunner中的每秒事务数 Requests per second:7841.29 [#/sec] (mean) # 相当于LoadRunner中的平均事务响应时间 Time per request:1.275 [ms] (mean) # 每个连接请求实际运行时间的平均值 Time per request:0.128 [ms] (mean, across all concurrent requests) Transfer rate:88788.85 [Kbytes/sec] received
Connection Times (ms) min mean[+/-sd] median max Connect:000.101 Processing:010.311 Waiting:000.201 Total:110.312
Percentage of the requests served within a certain time (ms) 50% 1 66% 1 75% 1 80% 1 90% 2 95% 2 98% 2 99% 2 100% 2 (longest request)
性能测试得到的最重要的指标是QPS(Requests per second),反映了接口的并发承受能力,也就是系统的峰值性能。如果对接口的调用超过了这一限制,就要考虑提升硬件或者做一些优化了。更多结果说明参考Web性能压力测试工具之ApacheBench详解。
2、指定测试的最大时间为10秒 ab -t 10 -n 1000000 http://localhost/ “-t”可以指定测试的最大时间,如果还不到此数请求已经发完,那么测试也会结束。当使用”-t”参数时,ab内部默认最大的请求数为50000,为了同时使用”-n”指定的参数,可以将”-t”参数放在”-n”参数之前。更多内容参考按时间进行压力测试。
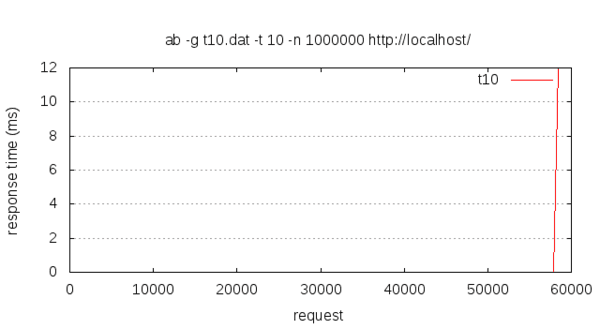
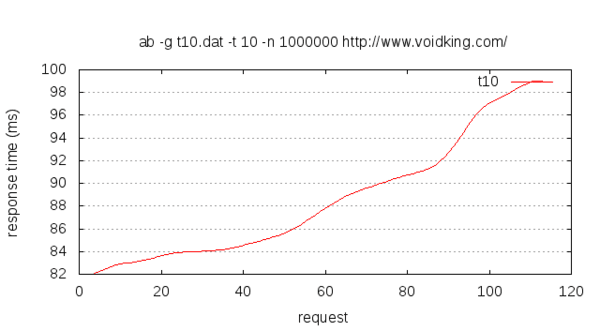
3、测试结果存入gnuplot格式的文件 ab -g t10.dat -t 10 -n 1000000 http://localhost/
The program 'gnuplot' can be found in the following packages:
 * gnuplot-nox
 * gnuplot-qt
 * gnuplot-x11
 * gnuplot5-nox
 * gnuplot5-qt
 * gnuplot5-x11
Try: sudo apt install <selected package>
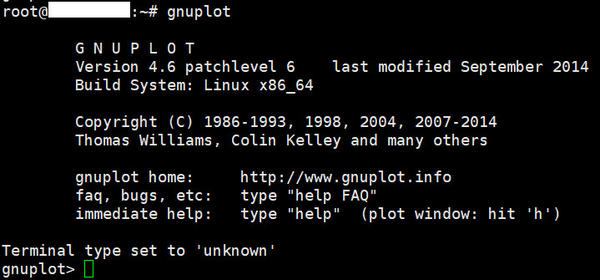
1、启动 输入gnuplot,进入gnuplotshell。 这里包含gnuplot的版本、系统、版权等信息。最关键的是最后一条: Terminal type set to ‘unknown’ 什么是terminal?在gnuplot中,terminal就是说你打算用什么方式输出图片。这里默认的terminal是unknown,因为我们安装了gnuplot-nox。一般需要修改为wxt,也就是直接输出到电脑屏幕上。
# output as png image
set terminal png  size 1000,560
set output "throughput.png"
#graph title
set title "Throughput"
set key invert reverse Left outside
# nicer aspect ratio for image size
#set size 1,0.6
# y-axis grid
set grid y
# x-axis label
set xlabel "time"
# y-axis label
set ylabel "responses per second"
plot "epochtime.dat" using 1:2 with lines title "t10"