1. ELK简介
ELK是一个日志分析平台,它主要由Elasticsearch、Logstash和Kibana三个部分组成。
Elasticsearch是一个开源的全文搜索和分析引擎,它可以实现数据的实时全文搜索,可以处理大规模日志数据,比如Nginx、Tomcat、系统日志等功能。
Logstash负责日志收集和转发,支持日志过滤,支持普通log、自定义json格式的日志解析。
Kibana通过接口调用Elasticsearch的数据,并进行前端数据可视化。
2. 部署规划
计划在三台CentOS7机器上部署ELK,其中一台机器作为ELK的服务节点,IP为192.168.56.101;另外两台作为客户节点,IP为192.168.56.102/103。
其中服务节点部署Elasticsearch、Logstash和Kibana三个组件,客户节点部署Logstash。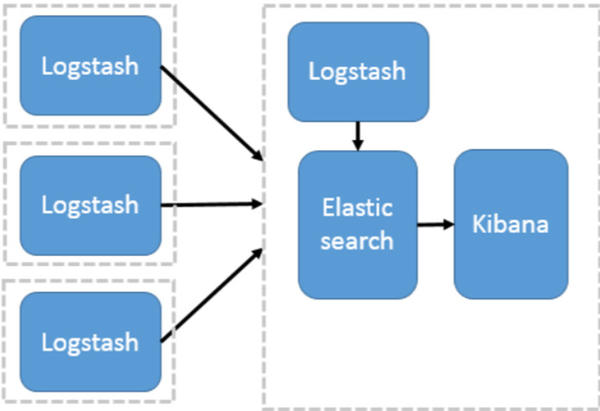
3. 服务节点部署
3.1. 环境准备
默认root用户下操作,其他用户请自觉添加sudo。
1、安装JDK,参考《全平台安装JDK》。
2、关闭防火墙。
1 | systemctl stop firewalld |
或者设置防火墙规则:
1 | firewall-cmd --add-port=9200/tcp --permanent |
3、添加ELK仓库
1 | cat <<EOF | tee /etc/yum.repos.d/elasticsearch.repo |
4、引入GPG key
1 | rpm --import https://artifacts.elastic.co/GPG-KEY-elasticsearch |
5、更新yum包
1 | yum clean all |
3.2. Elasticsearch
1、安装Elasticsearch
1 | yum install -y elasticsearch |
安装过程中会下载 https://artifacts.elastic.co/packages/7.x/yum/7.2.0/elasticsearch-7.2.0-x86_64.rpm ,但是,下载速度非常慢。这里建议通过浏览器下载,然后上传到服务节点上。上传完成后,执行安装:
1 | rpm -ivh elasticsearch-7.2.0-x86_64.rpm |
提示future versions of Elasticsearch will require Java 11; your Java version does not meet this requirement. 不过没关系,当前版本能用就行。
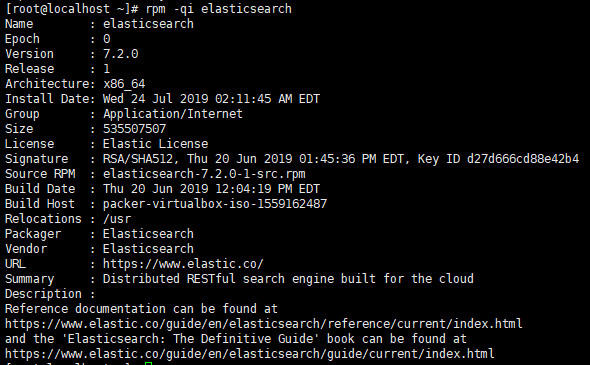
2、确认Elasticsearch的安装信息
1 | rpm -qi elasticsearch |
3、启动Elasticsearch并设置开机启动
1 | systemctl daemon-reload |
4、查看Elasticsearch运行状态
1 | systemctl status elasticsearch |
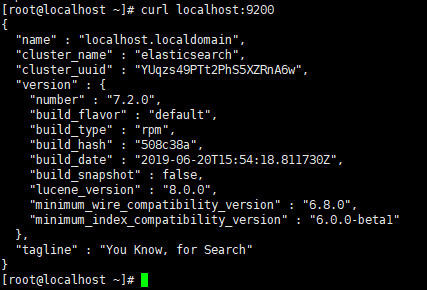
5、尝试请求
1 | curl localhost:9200 |
6、设置允许其他机器访问
当前只能响应本机的请求,想要其他机器也能访问的话,那么需要修改elasticsearch的配置。
1 | vim /etc/elasticsearch/elasticsearch.yml |
elasticsearch.yml如下修改:
1 | # line 17, uncomment |
7、重启Elasticsearch
1 | systemctl stop elasticsearch |
如果可以看到:::9200,就可以通过外部浏览器访问Elasticsearch服务了,至此Elasticsearch安装配置完成。
3.3. Kibana
1、安装Kibana
1 | yum install -y kibana |
同样的,如果下载速度缓慢,那么可以通过浏览器下载 https://artifacts.elastic.co/packages/7.x/yum/7.2.0/kibana-7.2.0-x86_64.rpm ,然后上传到服务节点,上传后执行安装:
1 | rpm -ivh kibana-7.2.0-x86_64.rpm |
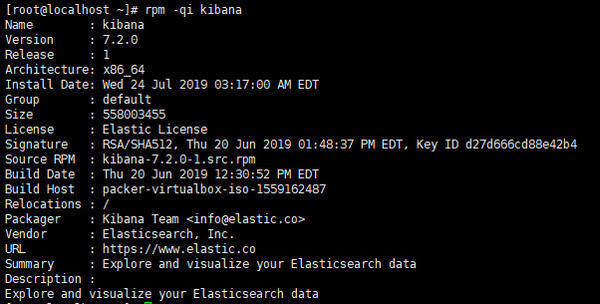
2、确认Kibana的安装信息
1 | rpm -qi kibana |
3、启动Kibana并设置开机启动
1 | systemctl start kibana |
4、查看Kibana运行状态
1 | systemctl status kibana |
5、测试访问
1 | curl localhost:5601 -L |
6、设置允许其他机器访问
1 | vim /etc/kibana/kibana.yml |
kibana.yml如下修改:
1 | # line 2, uncomment and change |
7、重启Kibana
1 | systemctl stop kibana |
如果可以看到0.0.0.0:5601,就可以通过外部浏览器访问Kibana服务了,至此Kibana安装配置完成。
3.4. Logstash
1、安装Logstash
1 | yum install -y logstash |
也可以通过浏览器下载 https://artifacts.elastic.co/packages/7.x/yum/7.2.0/logstash-7.2.0.rpm ,然后上传到服务节点,上传后执行安装:
1 | rpm -ivh logstash-7.2.0.rpm |
2、确认Logstash的安装信息rpm -qi logstash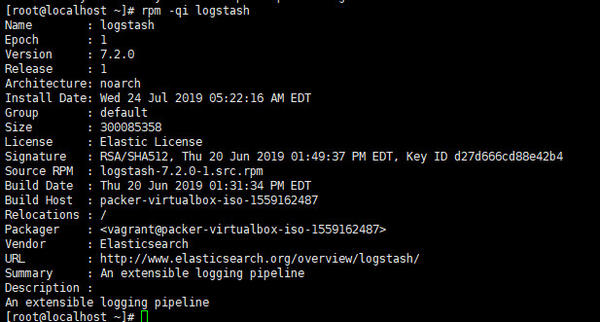
3、启动Logstash
1 | systemctl start logstash |
4、查看Logstash运行状态
1 | systemctl status logstash |
启动成功了,然后呢?怎么使用?
5、Logstash hello world
1 | systemctl stop logstash |
输入启动命令后,耐心等待服务启动,直到出现Successfully started Logstash API endpoint。输入“hello world”回车,即可打印出输出。
logstash通过管道来处理数据,标准的管道包含input、filter和output。以上命令,指定了一个管道的参数,没有filter,input是控制台标准输入,output是控制台标准输出。
6、管道配置写入文件
新建配置文件std.conf,内容为:
1 | input { |
7、测试配置文件并启动
1 | /usr/share/logstash/bin/logstash -f ~/std.conf --config.test_and_exit |
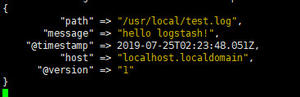
8、从文件中读取信息
(1)新建/usr/local/test.log文件,内容为:
1 | hello logstash! |
(2)新建test.conf,内容为:
1 | input { |
(3)启动Logstash
1 | /usr/share/logstash/bin/logstash -f ~/test.conf |
9、写入信息到文件
(1)修改test.conf为:
1 | input { |
(2)启动Logstash
1 | /usr/share/logstash/bin/logstash -f ~/test.conf |
启动后,/usr/local/目录下多了test.log.out文件。
3.5. 数据传递
Logstash收集到了数据,怎样传递给Elasticsearch显示?怎样传递给Kibana显示?
1、修改test.conf为:
1 | input { |
2、启动Logstash
1 | /usr/share/logstash/bin/logstash -f ~/test.conf |
3、查看索引
浏览器访问 http://192.168.56.101:9200/_cat/indices?v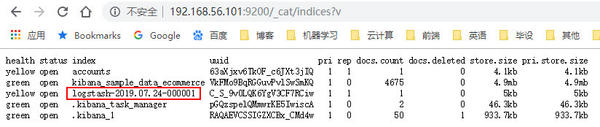
其中有个索引是logstash的,这就是我们想要查看的数据索引。
4、查看数据
浏览器访问 http://192.168.56.101:9200/logstash-2019.07.24-000001/_search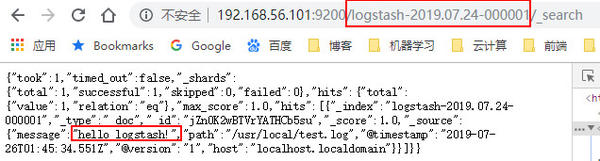
看到了hello logstash!,说明数据已经成功传递到了Elasticsearch。链接后添加?pretty参数,可以进行格式化显示。
5、Kibana添加indices
浏览器访问Kibana http://192.168.56.101:5601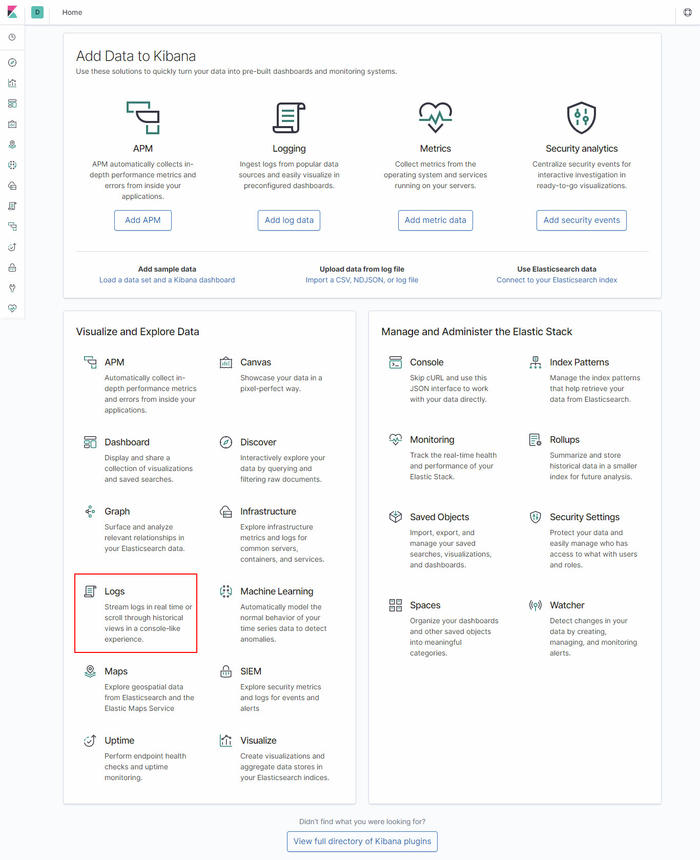
点击页面上的Logs,然后填写indices相关信息。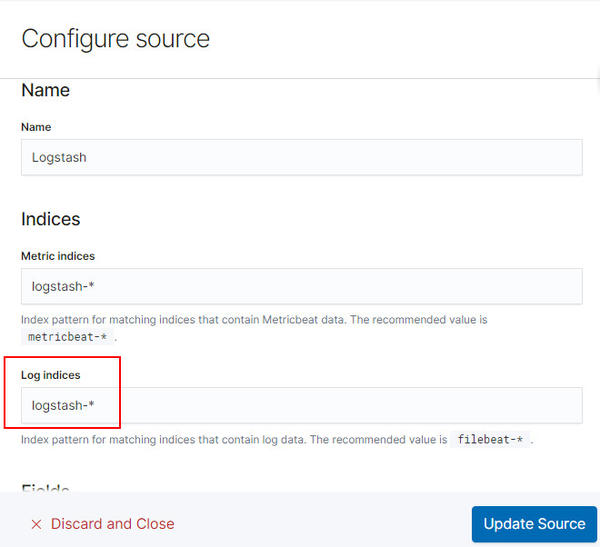
最后点击Update Source,即可在页面上看到Logstash传递的信息。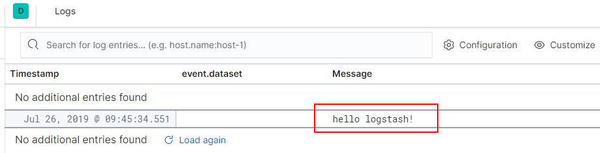
6、修改test.log
修改test.log为:
1 | hello logstash! |
再次查看Kibana的日志显示,可以看到更新。
4. 客户节点部署
4.1. 环境准备
默认root用户下操作,其他用户请自觉添加sudo。
1、安装JDK。
2、关闭防火墙。
1 | systemctl stop firewalld |
3、添加ELK仓库
1 | cat <<EOF | tee /etc/yum.repos.d/elasticsearch.repo |
4、引入GPG key
1 | rpm --import https://artifacts.elastic.co/GPG-KEY-elasticsearch |
5、更新yum包
1 | yum clean all |
4.2. Logstash
1、安装Logstash
1 | yum install -y logstash |
也可以通过浏览器下载 https://artifacts.elastic.co/packages/7.x/yum/7.2.0/logstash-7.2.0.rpm ,然后上传到服务节点,上传后执行安装:
1 | rpm -ivh logstash-7.2.0.rpm |
2、确认Logstash的安装信息
1 | rpm -qi logstash |
3、创建测试文件
新建配置文件test.conf,内容为:
1 | input { |
新建/usr/local/test.log,内容为:
1 | this is a log recorded by 102 |
4、启动logstash
1 | /usr/share/logstash/bin/logstash -f ~/test.conf |
5、在Kibana查看日志
刷新Kibana,即可看到客户节点的日志。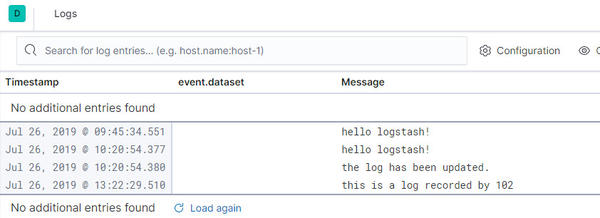
5. 后记
以上,完成了ELK的基本安装配置,实现了一个最简单的架构。Logstash收集数据,传递给Elasticsearch,然后Kibana显示Elasticsearch中的数据。更多关于ELK的内容,后续会继续学习。
PS:连接ES,推荐使用VSCode的Database Client for Visual Studio Code插件。
6. 书签
- How to Install ELK Stack on CentOS 7
- Logstash 实用介绍
- Getting Started with Logstash
- 开源日志实时分析平台ELK
- logstash的各个场景应用(配置文件均已实践过)
- Logstash介绍
- 在 CentOS7 安装 ELK
- ELK-7.0安装部署收集展示
- ELK部署安装以及配置
- Learn About the Elastic Stack
- Elastic 中文社区
- Elastic中文社区运维监控实战之架构篇
- 从零开始搭建ELK+GPE监控预警系统
- 《ELK Stack 中文指南》
- ELK不权威指南
- 零代码如何打造自己的实时监控预警系统
- Docker下ELK三部曲之一:极速体验